
10.5 使用逻辑分析仪测量串口通信
万用表、示波器、逻辑分析仪是电子工程师常用的测量设备。万用表主要用来测量电压、电流等参数,示波器一般用来测量模拟信号等信号质量参数,逻辑分析仪一般用来分析数字通信信号以及解析通信协议。对于串口通信这种数字通信,用逻辑分析仪可以清晰的测量出每一位的脉宽,波特率,还可以将串口通信数据直接解析出来,是数字信号分析利器。
下面使用Kingst品牌的 LA5016逻辑分析仪测量一下上一小节串口助手按照三种情况发送“31”后,单片机的RXD引脚接收到的波形数据,以及TXD引脚发送出去的波形数据,按照使用方法将逻辑分析仪的通道0和通道1分别接到单片机的RXD和TXD引脚上,GND接到单片机的GND插针上,测量到的波形如图10-5所示,从图上可以看到测量的单片机TXD发送引脚一个脉冲宽度大致是104.156us,9600波特率的一个位宽理论值是1/9600=104.166us。
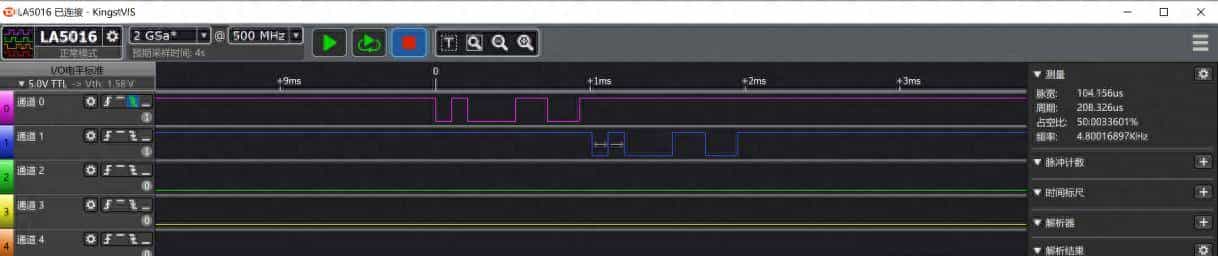
图10-5 逻辑分析仪信号测量图
逻辑分析仪不仅仅可以测量波形的脉冲宽度,周期,占空比频率这些信息,对于标准的通信协议,可以直接将波形解析出HEX格式,同时软件右下角也可以显示出解析后的数据。如图10-6所示。从图上还可以看出解析的过程中,有一个圆绿点表明串口起始位,白点表明数据位,方红点表明停止位。
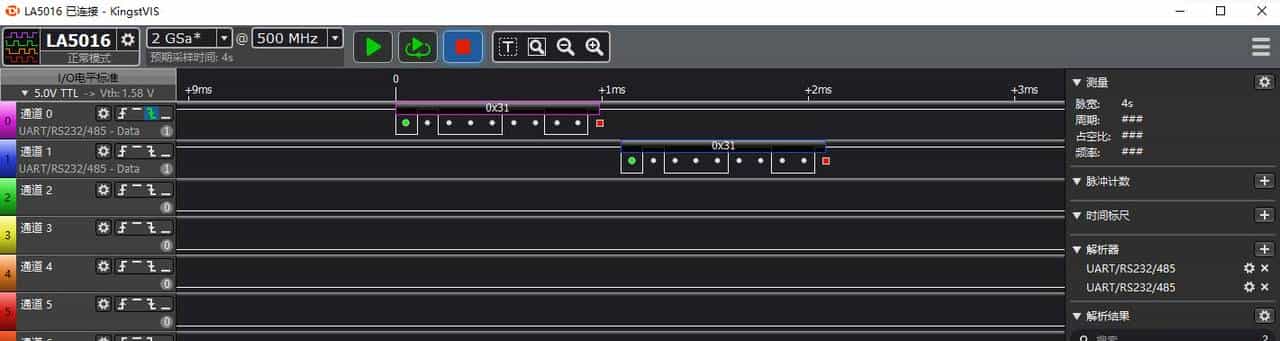
10-6 逻辑分析仪解析串口图(一)
除了可以显示成为十六进制数据,还可以显示成其他格式。将第三次发送的“文本模式”下的“31”的发送和接收数据显示格式,同时显示HEX和ASCII格式,如图10-7所示。
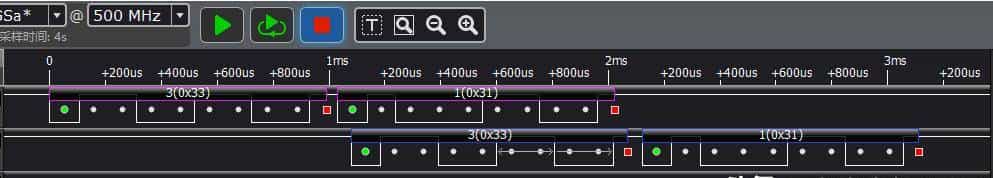
10-7 逻辑分析仪解析串口图(二)
合理使用工具,可以将一些信号参数更加清晰直观的展示出来,在项目开发过程中起到事半功倍的效果。
10.6 指针的概念与指针变量的声明
10.6.1 变量的地址
要研究指针,得先来深入理解内存地址这个概念。打个比方:整个内存就相当于一个拥有许多房间的大楼,每个房间都有房间号,列如从101、102、103一直到NNN,可以说这些房间号就是房间的地址。相对应的内存中的每个单元也都有自己的编号,列如从0x00、0x01、0x02一直到0xNN,同样可以说这些编号就是内存单元的地址。房间里可以住人,对应的内存单元里就可以“住进”变量了:如果一位名字叫A的人住在101房间,可以说A的住址就是101,或者101就是A的住址;对应的,如果一个名为x的变量住在编号为0x00的这个内存单元中,那么可以说变量x的内存地址就是0x00,或者0x00就是变量x的地址。
基本的内存单元是字节,英文单词为Byte,STC89C52单片机共有512字节的RAM内存,它分为内部256字节和外部256字节,仅以内部的256字节为例,很明显其地址的编号从0开始就是0x00~0xFF。用C语言定义的各种变量就存在0x00~0xFF的地址范围内,而不同类型的变量会占用不同数量的内存单元,可以结合前面讲过的C语言变量类型深入理解。如果目前定义了unsigned char a = 1; unsigned char b = 2; unsigned int c = 3; unsigned long d = 4; 这样4个变量,把这4个变量分别放到内存中,如表10-4所示。
表10-4 变量存储方式
|
内存地址 |
存储的数据 |
|
…… |
…… |
|
0x07 |
d |
|
0x06 |
d |
|
0x05 |
d |
|
0x04 |
d |
|
0x03 |
c |
|
0x02 |
c |
|
0x01 |
b |
|
0x00 |
a |
变量a、b和c和d之间的变量类型不同,因此在内存中所占的存储单元也不一样,a和b都占一个字节,c占了2个字节,而d占了4个字节。那么,a的地址就是0x00,b的地址就是0x01,c的地址就是0x02,d的地址就是0x04,它们的地址的表达方式可以写成:&a,&b,&c,&d。这样就代表了相应变量的地址,C语言中变量前加一个&表明取这个变量的地址,&在这里就叫做“取址符”。
这里有一点延伸内容,变量c是unsigned int类型的,占了2个字节,存储在了0x02和0x03这两个内存地址上,那么0x02是它的低字节还是高字节呢?这个问题由所用的C编译器与单片机架构共同决定,单片机类型不同就有可能不同。列如:在Keil+51单片机的环境下,0x02存的是高字节,0x03存的是低字节。这是编译底层实现上的细节问题,并不影响上层的应用,如下这两种情况在应用上丝毫不受这个细节的影响:强制类型转换——b = (unsigned char) c,那么b的值必定是c的低字节;取地址——&c,则得到的必定是0x02,这都是C语言本身所决定的规则,不因单片机编译器的不同而有所改变。
实际生活中要寻找一个人有两种方式,一种方式是通过它的名字来找人,还有第二种方式就是通过它的住址来找人。在派出所的户籍管理系统的信息输入方框内,输入小明的家庭住址,系统会自动指向小明的相关信息,输入小刚的家庭住址,系统会自动指向小刚的相关信息。这个供输入地址的方框,在户籍管理系统叫做“地址输入框”。
那么,在C语言中,要访问一个变量,同样有两种方式:一种是通过变量名来访问,另一种自然就是通过变量的地址来访问了。在C语言中,地址就等同于指针,变量的地址就是变量的指针。要把地址送到上边那个所谓的“地址输入框”内,这个“地址输入框”既可以输入x的指针,又可以输入y的指针,所以这个“地址输入框”相当于一个特殊的变量——保存指针的变量,因此称之为指针变量,简称为指针,一般说的指针是指指针变量。
地址输入框输入谁的地址,指向的就是这个人的信息,而给指针变量输入哪个普通变量的地址,它自然就指向了这个变量的内容,一般的说法就是指针指向了该变量。
10.6.2 指针变量的声明
在C语言中,变量的地址往往都是编译系统自动分配的,对用户来说是不知道某个变量的具体地址的。所以定义一个指针变量p,把普通变量a的地址直接送给指针变量p就是p = &a;这样的写法。
对于指针变量p的定义和初始化,一般有两种方式,这两种方式初学者很容易混淆,死记硬背完全记住是最好的办法。
方法1:定义时直接进行初始化赋值。
unsigned char a;
unsigned char *p = &a;
方法2:定义后再进行赋值。
unsigned char a;
unsigned char *p;
p = &a;
这两种写法都是正确的。定义的指针变量前边加了个*,这个*p就代表了这个p是个指针变量,不是个普通的变量,它是专门用来存放变量地址的。此外,定义*p的时候,用了unsigned char来定义,这里表明的是这个指针指向的变量类型是unsigned char型的。
指针变量比较好理解,但是为什么读者还是学不好指针呢?在C语言中,有一些运算和定义是有区别的。重点强调两个区别,只要把这两个区别弄清楚了,起码指针变量这部分就不是问题了。这两个重大区别也需要死记硬背记住。
第一个重大区别:指针变量p和普通变量a的区别。定义一个变量a,同时也可以给变量a赋值a = 1,也可以赋值a = 2。定义一个指针变量p,另外还定义了一个普通变量a=1,普通变量b=2,那么这个指针变量可以指向a的地址,也可以指向b的地址,可以写成p = &a,也可以写成p = &b,就是不能写成p = 1或者p = 2或者p = a,这三种表达方式都是错的。
因此这里不要看到定义*p的时候前边有个unsigned char型,就错误的赋值p=1,这个只是说明p指向的变量是这个unsigned char类型的,而p本身,是指针变量,不可以给它赋值普通的值或者变量,后边会直接把指针变量称之为指针,要注意一下这个小细节。
第二个重大区别:定义指针变量*p和取值运算*p的区别。
“*”这个符号,在C语言有三个用法,第一个用法是乘法运算符号。
第二个用法,是定义指针变量的时候用的,列如unsigned char *p,这个地方使用“*”代表的意思是p是一个指针变量,而非普通的变量。
第三种用法,是取值运算,它和定义指针变量是完全两码事,列如:
unsigned char a = 1;
unsigned char b = 2;
unsigned char *p;
p = &a;
b = *p;
这样运算完之后,b的值为1。在这段代码中,&a表明取a这个变量的地址,把这个地址送给p,再用*p运算是取指针变量p指向的地址的变量的值,把这个值送给b,结果相当于b=a。同样是*p,放在定义的位置就是定义指针变量,放在执行代码中就是取值运算。
10.6.3 指针的简单示例
为了巩固指针的用法,使用指针实现流水灯程序,从简单程序开始了解指针。
#include <reg52.h>
sbit ADDR0 = P1^0;
sbit ADDR1 = P1^1;
sbit ADDR2 = P1^2;
sbit ADDR3 = P1^3;
sbit ENLED = P1^4;
void ShiftLeft(unsigned char *p);
void main()
{
unsigned int i;
unsigned char buf = 0x01;
ENLED = 0; //使能选择独立LED
ADDR3 = 1;
ADDR2 = 1;
ADDR1 = 1;
ADDR0 = 0;
while (1)
{
P0 = ~buf; //缓冲值取反送到P0口
for (i=0; i<20000; i++); //延时
ShiftLeft(&buf); //缓冲值左移一位
if (buf == 0) //如移位后为0则重赋初值
{
buf = 0x01;
}
}
}
/* 将指针变量p指向的字节左移一位 */
void ShiftLeft(unsigned char *p)
{
*p = *p << 1; //利用指针变量可以向函数外输出运算结果
}
这是一个使用指针实现流水灯的例子,纯粹是为了讲指针而写这样一段程序,程序中传递的是buf的地址,把这个地址直接传递给函数ShiftLeft的形参指针变量p,也就是p指向了buf。对比之前的函数调用有重大区别,如果是普通变量传递,只能单向的,也就是说,主函数传递给子函数的值,子函数只能使用却不能改变。而目前传递的是指针,*p就是直接取了buf这个变量的值,并且将其进行了修改。
再次强调,只要是*p前边带了变量类型如unsigned char,就是表明定义了一个指针变量p,而执行代码中的*p,是指p所指向的内容。
通过理论的学习和这样一个例程对指针有一个初步的认识,至于它的灵活应用,需要在后边的程序中慢慢去体会。
© 版权声明
文章版权归作者所有,未经允许请勿转载。


辛苦了!虽然不是都能看明白,尽量多看。
感谢! 官网:青岛金思特电子有限公司 有配套的视频讲解,可以搭配一起学习更便于理解
谢谢!为你的敬业点赞!