目的:通过从A股筛选高价值的股票(连续5年ROE大于15%),并进行TOP10标的的排序和可视化展示。
详细代码:
import baostock as bs
import pandas as pd
import numpy as np
import matplotlib.pyplot as plt
import matplotlib
from datetime import datetime
import time
import warnings
warnings.filterwarnings('ignore')
# 设置中文字体
matplotlib.rcParams['font.sans-serif'] = ['SimHei', 'Arial Unicode MS', 'DejaVu Sans']
matplotlib.rcParams['axes.unicode_minus'] = False
class ROEAnalyzer:
"""ROE分析器,筛选连续5年ROE>15%的股票"""
def __init__(self, stocklist_file='all_stocklist_simple.csv'):
self.stocklist_file = stocklist_file
self.stock_list = []
self.results = []
self.login_success = False
def load_stock_list(self):
"""加载股票列表"""
print(f"正在加载股票列表: {self.stocklist_file}")
try:
df = pd.read_csv(self.stocklist_file, encoding='utf-8-sig')
print(f"成功加载 {len(df)} 只股票")
# 提取股票代码
self.stock_list = df['股票代码'].tolist()
return True
except Exception as e:
print(f"加载股票列表失败: {e}")
return False
def login_baostock(self):
"""登录baostock"""
try:
lg = bs.login()
if lg.error_code == '0':
print("登录成功")
self.login_success = True
return True
else:
print(f"登录失败: {lg.error_msg}")
return False
except Exception as e:
print(f"登录异常: {e}")
return False
def logout_baostock(self):
"""登出baostock"""
if self.login_success:
bs.logout()
print("已登出")
def get_roe_data(self, stock_code, years):
"""获取指定股票在指定年份的ROE数据"""
roe_data = {}
for year in years:
try:
# 查询盈利能力数据
rs = bs.query_profit_data(
code=stock_code,
year=year,
quarter=4 # 使用年报数据
)
if rs.error_code == '0':
data = rs.get_data()
if not data.empty and 'roeAvg' in data.columns:
value = data.iloc[0]['roeAvg']
if pd.notna(value):
# roeAvg字段是小数形式,如0.15表明15%
roe_data[year] = float(value)
else:
# 静默处理查询失败
pass
except Exception as e:
# 静默处理异常
pass
# 避免请求过快
time.sleep(0.03) # 稍微减少等待时间,加快整体速度
return roe_data
def analyze_stock_roe(self, stock_code, stock_name="未知", years=None):
"""分析单只股票的ROE数据"""
if years is None:
years = [2020, 2021, 2022, 2023, 2024] # 使用2020-2024年数据
# 获取ROE数据
roe_data = self.get_roe_data(stock_code, years)
# 检查是否所有年份都有数据
if len(roe_data) < len(years):
return None # 数据不全
# 检查是否所有年份ROE>0.15
all_years_valid = True
roe_values = []
for year in years:
if year in roe_data:
roe = roe_data[year]
roe_values.append(roe)
if roe <= 0.15: # 注意:这里是小数形式
all_years_valid = False
break
else:
all_years_valid = False
break
if all_years_valid:
# 计算平均ROE(转换为百分比形式)
avg_roe = (sum(roe_values) / len(roe_values)) * 100
return {
'股票代码': stock_code,
'股票名称': stock_name,
'平均ROE(%)': round(avg_roe, 2),
'ROE数据': {year: round(roe_data[year] * 100, 2) for year in years},
'ROE值列表': [round(roe * 100, 2) for roe in roe_values],
'年份列表': years
}
return None
def get_stock_name_from_code(self, stock_code):
"""根据股票代码获取股票名称"""
# 尝试从原始数据中获取名称
try:
df = pd.read_csv(self.stocklist_file, encoding='utf-8-sig')
match = df[df['股票代码'] == stock_code]
if not match.empty:
return match.iloc[0]['股票名称']
except:
pass
# 如果无法从文件中获取,尝试从baostock获取
try:
rs = bs.query_stock_basic(code=stock_code)
if rs.error_code == '0':
data = rs.get_data()
if not data.empty and 'code_name' in data.columns:
return data.iloc[0]['code_name']
except:
pass
return "未知"
def screen_high_roe_stocks(self):
"""筛选高ROE股票"""
print("
开始筛选高ROE股票...")
print("筛选条件: 连续5年(2020-2024)ROE>15%")
print(f"分析股票数量: {len(self.stock_list)}")
if not self.login_success:
if not self.login_baostock():
return []
results = []
total_stocks = len(self.stock_list)
for i, stock_code in enumerate(self.stock_list):
# 显示进度
if i % 50 == 0:
print(f"已分析 {i}/{total_stocks} 只股票 ({i/total_stocks*100:.1f}%),已找到 {len(results)} 只符合条件的股票")
try:
# 获取股票名称
stock_name = self.get_stock_name_from_code(stock_code)
# 分析ROE
roe_info = self.analyze_stock_roe(stock_code, stock_name)
if roe_info:
results.append(roe_info)
# 每找到10只股票显示一次
if len(results) % 10 == 0:
print(f" 找到第{len(results)}只: {stock_code} {stock_name}, 平均ROE: {roe_info['平均ROE(%)']}%")
except Exception as e:
# 静默处理异常
pass
# 按平均ROE排序
results.sort(key=lambda x: x['平均ROE(%)'], reverse=True)
return results
def save_results_to_csv(self, results, filename=None):
"""保存结果到CSV文件"""
if not results:
print("没有结果可以保存")
return None
# 准备数据
data_list = []
for stock in results:
roe_data = stock['ROE数据']
row = {
'股票代码': stock['股票代码'],
'股票名称': stock['股票名称'],
'平均ROE(%)': stock['平均ROE(%)'],
'2020年ROE(%)': roe_data.get(2020, ''),
'2021年ROE(%)': roe_data.get(2021, ''),
'2022年ROE(%)': roe_data.get(2022, ''),
'2023年ROE(%)': roe_data.get(2023, ''),
'2024年ROE(%)': roe_data.get(2024, ''),
}
data_list.append(row)
# 创建DataFrame
df = pd.DataFrame(data_list)
# 设置文件名
if filename is None:
timestamp = datetime.now().strftime("%Y%m%d_%H%M%S")
filename = f"high_roe_stocks_{timestamp}.csv"
# 保存到CSV
df.to_csv(filename, index=False, encoding='utf-8-sig')
print(f"
筛选结果已保存到: {filename}")
print(f"共找到 {len(df)} 只符合条件的股票")
# 显示前10只股票
print("
前10只高ROE股票:")
print("-" * 100)
print(f"{'排名':<5} {'股票代码':<12} {'股票名称':<20} {'平均ROE(%)':<12} {'2020':<8} {'2021':<8} {'2022':<8} {'2023':<8} {'2024':<8}")
print("-" * 100)
for i, stock in enumerate(results[:10], 1):
roe_values = stock['ROE值列表']
years = stock['年份列表']
# 创建年份到ROE值的映射
roe_dict = {}
for year, roe in zip(years, roe_values):
roe_dict[year] = roe
print(f"{i:<5} {stock['股票代码']:<12} {stock['股票名称'][:18]:<20} "
f"{stock['平均ROE(%)']:<12.2f} "
f"{roe_dict.get(2020, ''):<8.2f} {roe_dict.get(2021, ''):<8.2f} "
f"{roe_dict.get(2022, ''):<8.2f} {roe_dict.get(2023, ''):<8.2f} "
f"{roe_dict.get(2024, ''):<8.2f}")
return df
def visualize_top_stocks(self, results, top_n=10):
"""可视化Top N股票"""
if len(results) < top_n:
print(f"只有 {len(results)} 只符合条件的股票,无法展示 {top_n} 只")
top_n = min(len(results), 5)
if top_n == 0:
print("没有股票可以可视化")
return
top_stocks = results[:top_n]
# 创建图表
fig, axes = plt.subplots(2, 2, figsize=(16, 12))
# 图表1: 平均ROE柱状图
ax1 = axes[0, 0]
stock_labels = []
avg_roes = []
for stock in top_stocks:
# 简化显示名称
if stock['股票名称'] != '未知':
display_name = f"{stock['股票名称'][:10]}
({stock['股票代码']})"
else:
display_name = stock['股票代码']
stock_labels.append(display_name)
avg_roes.append(stock['平均ROE(%)'])
bars = ax1.bar(range(len(stock_labels)), avg_roes, color='skyblue', edgecolor='black')
ax1.set_xlabel('股票', fontsize=12)
ax1.set_ylabel('平均ROE (%)', fontsize=12)
ax1.set_title(f'连续5年ROE>15% Top {top_n} 股票 (2020-2024年)', fontsize=14, fontweight='bold')
ax1.set_xticks(range(len(stock_labels)))
ax1.set_xticklabels(stock_labels, rotation=45, ha='right', fontsize=10)
ax1.axhline(y=15, color='red', linestyle='--', alpha=0.5, label='15%基准线')
# 在柱子上添加数值
for bar, roe in zip(bars, avg_roes):
height = bar.get_height()
ax1.text(bar.get_x() + bar.get_width()/2., height + 0.5,
f'{roe:.1f}%', ha='center', va='bottom', fontsize=10)
# 图表2: ROE趋势图
ax2 = axes[0, 1]
years = [2020, 2021, 2022, 2023, 2024]
# 只显示前5只的详细趋势
for i, stock in enumerate(top_stocks[:5]):
if len(stock['ROE值列表']) == len(years):
ax2.plot(years, stock['ROE值列表'],
marker='o', linewidth=2,
label=f"{stock['股票名称'][:10]} ({stock['股票代码']})")
ax2.set_xlabel('年份', fontsize=12)
ax2.set_ylabel('ROE (%)', fontsize=12)
ax2.set_title('Top 5 股票ROE年度趋势', fontsize=14, fontweight='bold')
ax2.legend(bbox_to_anchor=(1.05, 1), loc='upper left')
ax2.grid(True, alpha=0.3)
ax2.axhline(y=15, color='red', linestyle='--', alpha=0.5, label='15%基准线')
# 图表3: ROE分布直方图
ax3 = axes[1, 0]
all_roes = []
for stock in results:
all_roes.append(stock['平均ROE(%)'])
ax3.hist(all_roes, bins=20, color='lightgreen', edgecolor='black', alpha=0.7)
ax3.set_xlabel('平均ROE (%)', fontsize=12)
ax3.set_ylabel('股票数量', fontsize=12)
ax3.set_title(f'全部 {len(results)} 只股票平均ROE分布', fontsize=14, fontweight='bold')
ax3.axvline(x=15, color='red', linestyle='--', alpha=0.5, label='15%基准线')
ax3.legend()
# 图表4: 板块分布
ax4 = axes[1, 1]
# 统计各板块数量
sector_counts = {
'上证主板': 0,
'科创板': 0,
'深证主板': 0,
'创业板': 0
}
for stock in results:
code = stock['股票代码']
if code.startswith('sh.6') and not code.startswith('sh.688'):
sector_counts['上证主板'] += 1
elif code.startswith('sh.688'):
sector_counts['科创板'] += 1
elif code.startswith('sz.0'):
sector_counts['深证主板'] += 1
elif code.startswith('sz.3'):
sector_counts['创业板'] += 1
# 过滤掉数量为0的板块
sectors = [k for k, v in sector_counts.items() if v > 0]
counts = [v for v in sector_counts.values() if v > 0]
colors = ['gold', 'lightcoral', 'lightskyblue', 'lightgreen']
if sum(counts) > 0:
ax4.pie(counts, labels=sectors, colors=colors[:len(sectors)],
autopct='%1.1f%%', startangle=90, shadow=True)
ax4.set_title('高ROE股票板块分布', fontsize=14, fontweight='bold')
else:
ax4.text(0.5, 0.5, '无板块数据', ha='center', va='center', fontsize=14)
ax4.set_title('高ROE股票板块分布', fontsize=14, fontweight='bold')
plt.tight_layout()
# 保存图表
timestamp = datetime.now().strftime("%Y%m%d_%H%M%S")
chart_filename = f"high_roe_stocks_chart_{timestamp}.png"
plt.savefig(chart_filename, dpi=300, bbox_inches='tight')
plt.show()
print(f"
可视化图表已保存为: {chart_filename}")
return chart_filename
def run_analysis(self):
"""运行完整的分析流程"""
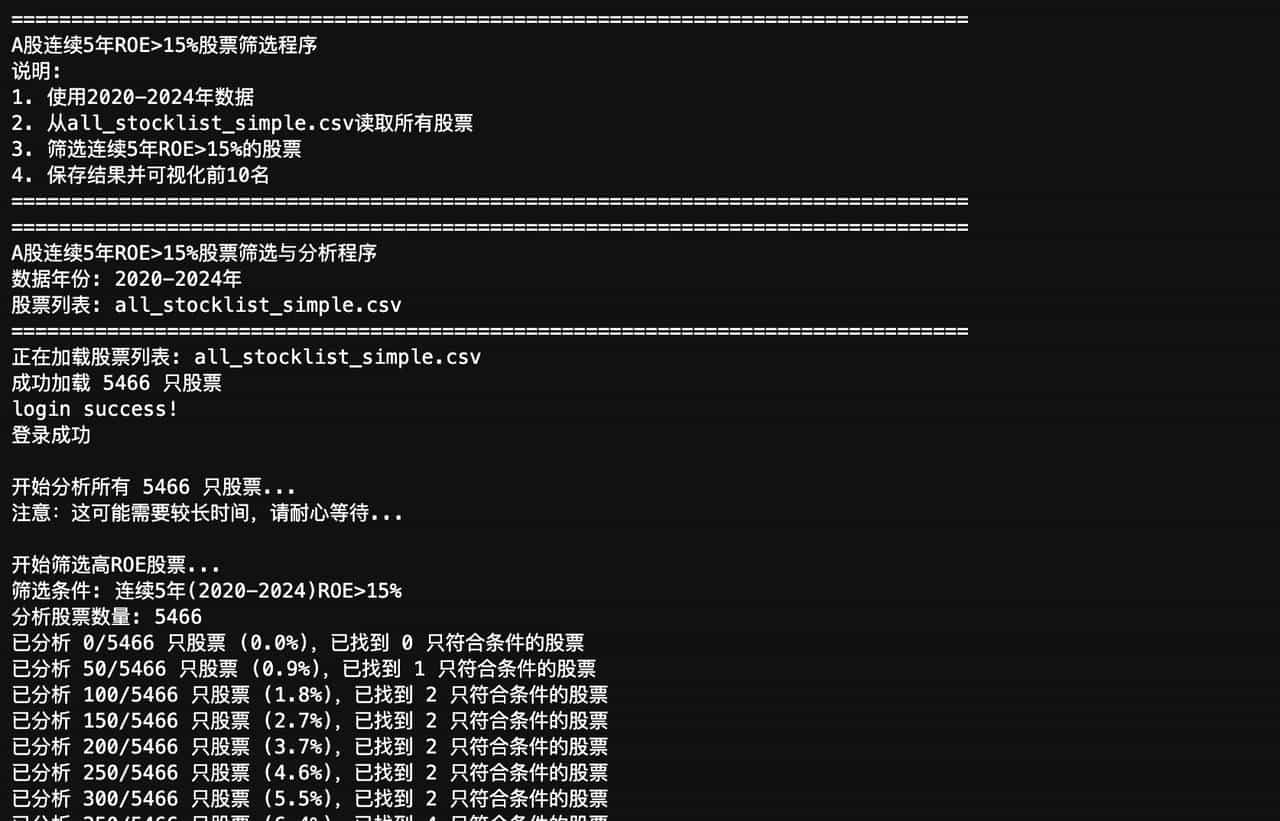
print("=" * 80)
print("A股连续5年ROE>15%股票筛选与分析程序")
print("数据年份: 2020-2024年")
print(f"股票列表: {self.stocklist_file}")
print("=" * 80)
# 加载股票列表
if not self.load_stock_list():
print("无法加载股票列表,程序退出")
return
# 登录baostock
if not self.login_baostock():
print("登录失败,程序退出")
return
try:
# 筛选高ROE股票
print(f"
开始分析所有 {len(self.stock_list)} 只股票...")
print("注意:这可能需要较长时间,请耐心等待...")
start_time = time.time()
results = self.screen_high_roe_stocks()
end_time = time.time()
print(f"
筛选完成!耗时: {end_time-start_time:.1f}秒")
if results:
# 保存结果到CSV
df = self.save_results_to_csv(results)
# 可视化Top 10
self.visualize_top_stocks(results, top_n=10)
# 显示更多统计信息
print("
" + "=" * 60)
print("统计摘要:")
print("=" * 60)
print(f"总分析股票数: {len(self.stock_list)}")
print(f"符合条件的股票数: {len(results)}")
print(f"筛选通过率: {len(results)/len(self.stock_list)*100:.2f}%")
if len(results) > 0:
# ROE统计
roe_values = [stock['平均ROE(%)'] for stock in results]
print(f"平均ROE范围: {min(roe_values):.1f}% - {max(roe_values):.1f}%")
print(f"平均ROE中位数: {np.median(roe_values):.1f}%")
# 板块分布
print("
板块分布:")
sector_counts = {}
for stock in results:
code = stock['股票代码']
if code.startswith('sh.6') and not code.startswith('sh.688'):
sector_counts['上证主板'] = sector_counts.get('上证主板', 0) + 1
elif code.startswith('sh.688'):
sector_counts['科创板'] = sector_counts.get('科创板', 0) + 1
elif code.startswith('sz.0'):
sector_counts['深证主板'] = sector_counts.get('深证主板', 0) + 1
elif code.startswith('sz.3'):
sector_counts['创业板'] = sector_counts.get('创业板', 0) + 1
for sector, count in sector_counts.items():
print(f" {sector}: {count}只 ({count/len(results)*100:.1f}%)")
else:
print("
未找到符合条件的股票")
print("可能的缘由:")
print("1. 2024年年报数据可能尚未完全公布")
print("2. 部分股票可能某些年份数据缺失")
print("3. 筛选条件较为严格")
# 测试几只股票的ROE数据
print("
测试几只股票的ROE数据...")
test_codes = ['sh.600519', 'sz.000858', 'sz.000333'] # 茅台、五粮液、美的
for test_code in test_codes:
test_name = self.get_stock_name_from_code(test_code)
test_result = self.analyze_stock_roe(test_code, test_name)
if test_result:
print(f"
{test_code} {test_name}:")
print(f" 平均ROE: {test_result['平均ROE(%)']}%")
for year, roe in test_result['ROE数据'].items():
print(f" {year}年: {roe}%")
else:
print(f"
{test_code}: 不符合条件或数据不全")
finally:
# 登出
self.logout_baostock()
# 主程序
if __name__ == "__main__":
print("=" * 80)
print("A股连续5年ROE>15%股票筛选程序")
print("说明:")
print("1. 使用2020-2024年数据")
print("2. 从all_stocklist_simple.csv读取所有股票")
print("3. 筛选连续5年ROE>15%的股票")
print("4. 保存结果并可视化前10名")
print("=" * 80)
# 运行完整分析
analyzer = ROEAnalyzer()
analyzer.run_analysis()运行效果:
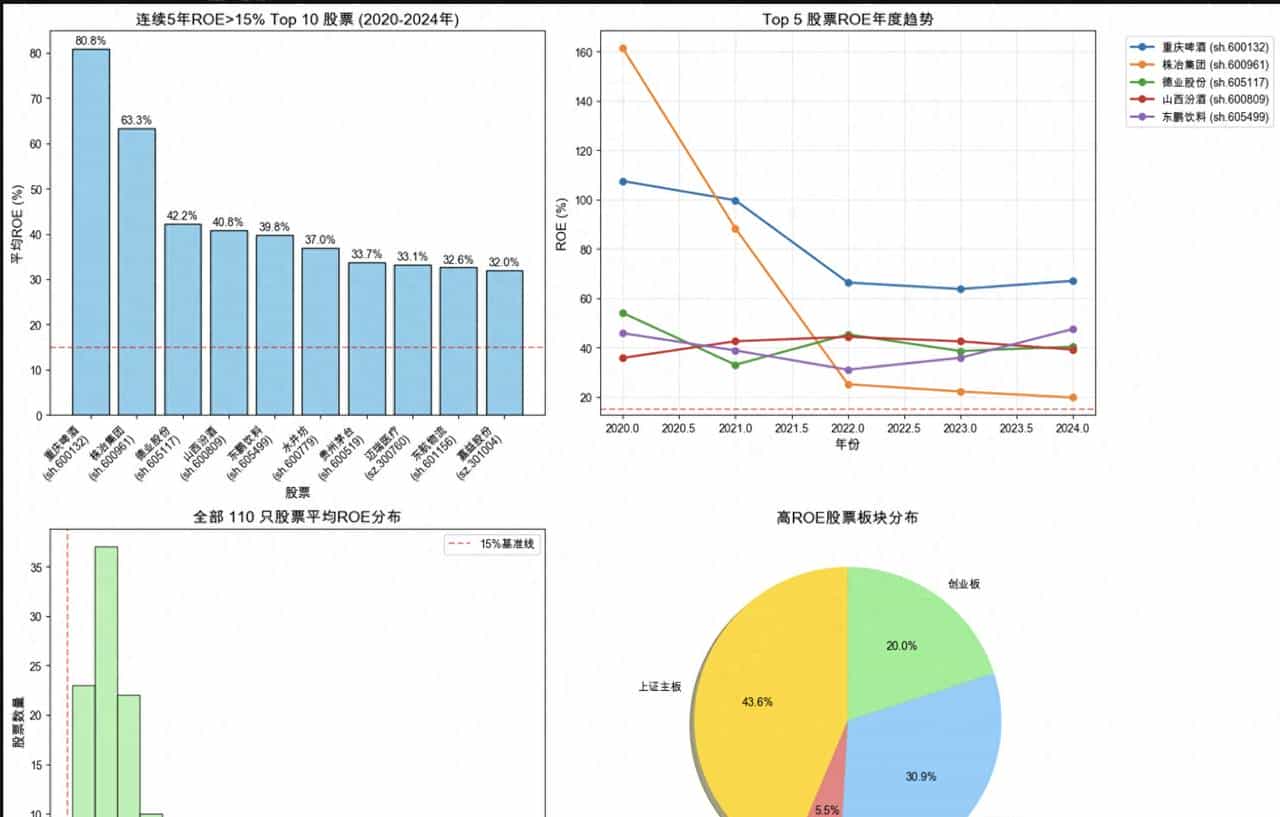
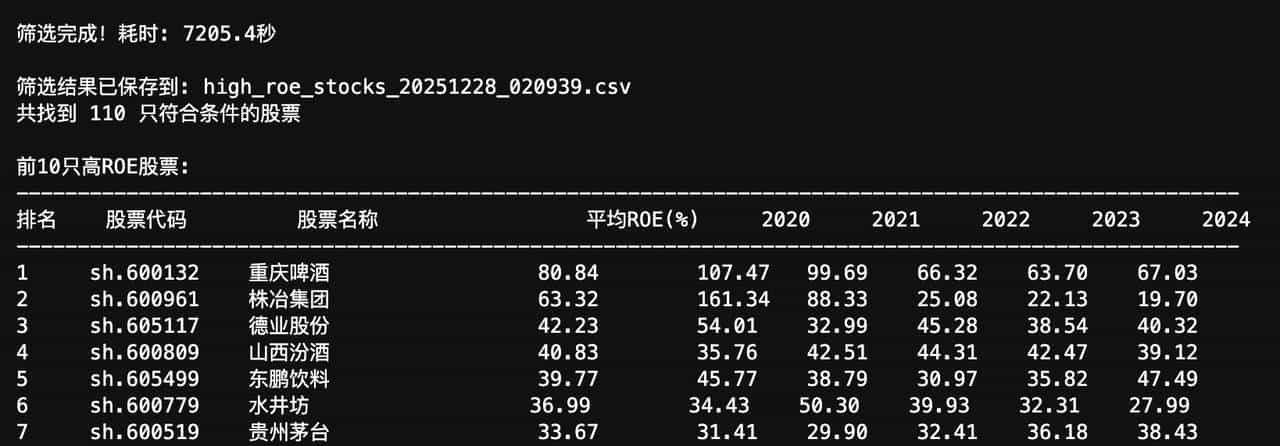
总结:通过baostock调用分析筛选出110家ROE大于15%的高价值股票,存入文件夹(观察仓);并对top10标的进行可视化展示(核心标的),并对核心标的的行业分布进行区分。
欢迎大家关注,点赞,收藏; 有兴趣交流的小伙伴可以私信沟通哦。
© 版权声明
文章版权归作者所有,未经允许请勿转载。
相关文章


暂无评论...